


Intelligent Alerting Lab
MyDecisive's SmartHub comes with a modular snap-in architecture. Octant uses it and so can you. Learn more through examples here in our platform pages. Real-time alerts. Zero alert fatigue.
One engine, full context on every event
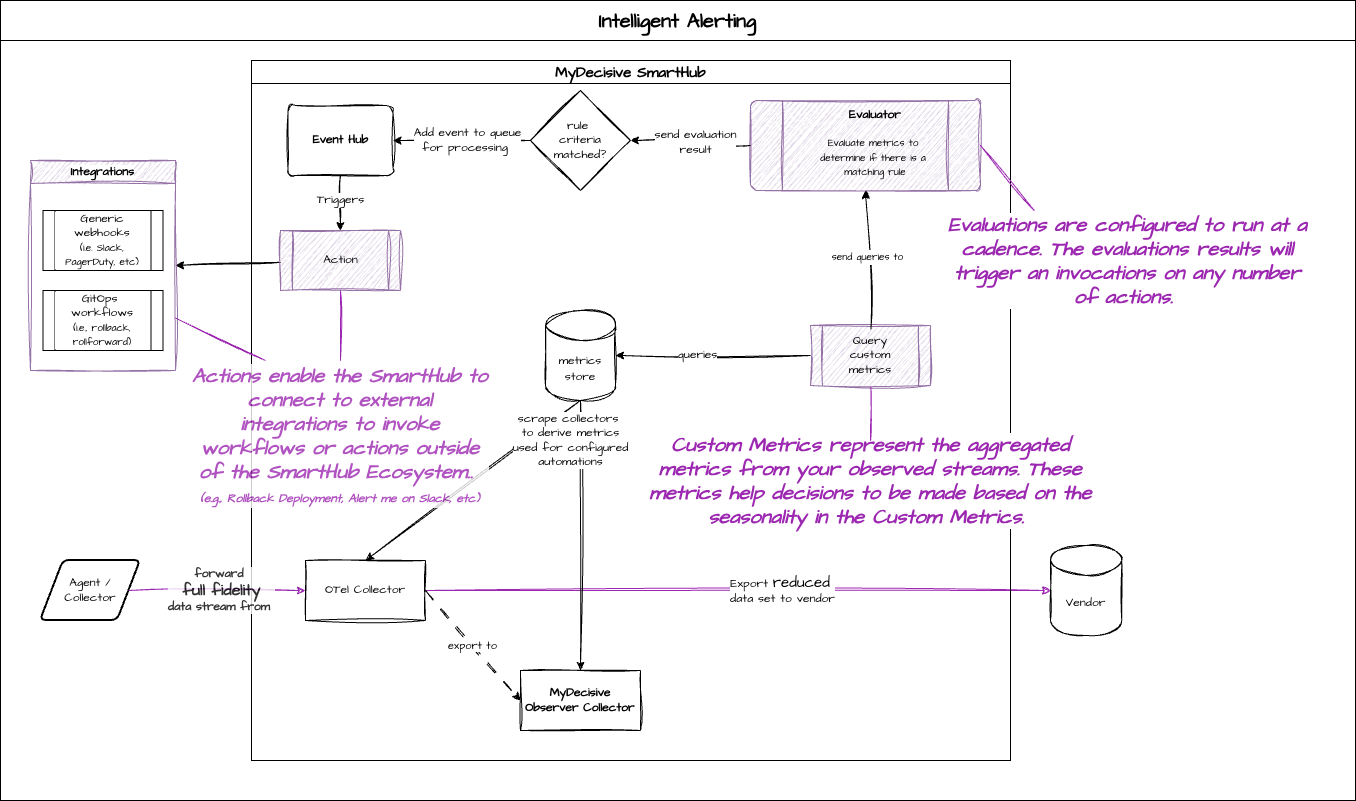
Our stateful engine evaluates every alert against your live telemetry stream On the Wire, as it happens — driving MTTR toward zero without drowning your team in noise.
Get started with docsAdvanced Alerting Capabilities
Alerts evaluate instantly against the live stream, using recent state instead of a single isolated data point.
Trigger any automation directly from an alert — rollback, page, remediate — with no separate rules engine.
Evaluate against 100% of your telemetry — not a sampled subset — for decisions you can trust.
The result is simple: More Visibility. More Precision. More Flexibility.
Zero-work, full coverage on day one.
SmartHub gives you a working baseline the moment it's deployed — no rules to write first.
100% CoverageEvery service, component, and infrastructure element is monitored automatically.
Zero setup Full coverage on deploy — nothing to configure before it's useful.
Open source Built on OpenTelemetry, Kubernetes, and Prometheus — no new stack to learn.
Stateful vs. stateless: fewer false positives
| Feature | Stateless(Legacy SaaS) | SmartHub Stateful |
|---|---|---|
| Logic | Evaluates each data point in isolation | Evaluates against recent events and system state |
| Context | Sees only the metric or log line itself | Full in-memory access to related logs, metrics, and trace |
| Noise reduction | Simple delay or n-out-of-m checks, misses complex conditions | Temporal logic — e.g. alert only if X holds for Z minutes |
| Example | A 10-second CPU spike triggers a page | Same spike is checked against a 3-minute threshold — no page |
The Value of Stateful Precision
SmartHub alerts go beyond simple thresholds — they understand context, correlate signals, and know when to act on their own.
Alerts fire only when a condition holds steady over time — not on a single blip. That means fewer false alarms and more trust in every notification you get.
Before raising an alert, SmartHub checks for related events. A latency spike caused by a planned cache refresh, for example, won't trigger a page — because the system already knows why it happened.
Alerts can act before they escalate. If latency climbs, SmartHub can trigger auto-remediation first, and only loop in a human if the issue persists — for example, 5 minutes after the fix attempt.
The result: less noise, faster resolution, and alerts your team can actually trust.


